Kp Index Explained: How to Read a Northern Lights Forecast, G-Scale and Aurora Map
- The Kp index runs from 0 to 9; each step pushes the auroral oval about 2 degrees of geomagnetic latitude toward the equator.
- NOAA's G-scale starts at G1 (Kp 5, northern Michigan and Maine) and tops out at G5 (Kp 9, aurora seen as low as Florida and southern Texas).
- The OVATION 30-minute forecast is the most reliable product, but it only looks 30 to 90 minutes ahead.
- The best aurora is usually between 10 p.m. and 2 a.m. local time, with more storms near the equinoxes.
- Long-range outlooks such as SWPC's 27-day outlook are for rough planning only.
- How an aurora forecast works: three time scales
- The Kp index explained
- NOAA's G-scale: geomagnetic storms from G1 to G5
- Which Kp do you need in your state?
- The OVATION model and the 30-minute aurora forecast
- The 3-day forecast, the viewline and the 27-day outlook
- When the aurora is most likely: time of night and season
- Why aurora forecasts miss
- Forecast terms at a glance
This article is part of the 77.today Night Sky Guide, prepared by the 77.today editors from the sources listed at the end.
Just want to know about tonight? Check tonight's northern lights forecast for your city – our live page turns NOAA's Kp forecast, the OVATION model and hourly cloud cover into a city-by-city outlook, updated every 30 minutes. This article explains what is behind those numbers.
Every aurora forecast you see – on a phone app, a TV weather segment or our own live tool – starts with the same handful of products from the National Oceanic and Atmospheric Administration's Space Weather Prediction Center (SWPC) in Boulder, Colorado. Once you know what those products measure, a northern lights forecast stops being a mysterious green blob and becomes a practical tool: you can tell whether tonight is worth a drive out of town, how far south the lights might reach and when to step outside. This part of our Night Sky Guide explains the Kp index, NOAA's G-scale for geomagnetic storms, the OVATION aurora model behind the 30-minute forecast, and how all three translate into a realistic answer to the question everybody types into a search bar: will I see the northern lights tonight?
How an aurora forecast works: three time scales
The aurora is the visible glow of charged particles from the Sun's solar wind slamming into oxygen and nitrogen high in Earth's atmosphere. The particles are funneled toward the magnetic poles, so on an average night the aurora sits in a ring – the auroral oval – over Alaska, northern Canada, Greenland and northern Scandinavia. When a burst of solar wind or a coronal mass ejection (CME) disturbs Earth's magnetic field, that ring brightens and expands toward the equator. A forecast is really a forecast of how disturbed the magnetic field will be.
SWPC publishes that forecast on three very different time scales, and mixing them up is the most common reason people feel misled by an aurora app:
| Product | Looks ahead | Based on | Best used for |
|---|---|---|---|
| Aurora 30-minute forecast (OVATION) | 30–90 minutes | Solar wind measured by spacecraft about 1 million miles upstream | Deciding whether to go outside right now |
| 3-day forecast and aurora viewline | Tonight to 3 days | Observed eruptions on the Sun and their expected arrival | Planning an evening or a short drive |
| 27-day outlook | Up to 27 days | The Sun's 27-day rotation bringing active regions back into view | Rough trip planning only |
The further ahead a forecast looks, the less it knows. A 3-day forecast can tell you that a CME left the Sun and is expected to arrive, but not exactly when it will hit or how strongly it will couple to Earth's field. The 30-minute forecast is far more reliable because it uses measurements of solar wind that is already on its way – but it gives you less than an hour and a half of warning.
The Kp index explained
The Kp index is the number you will see quoted most often. It is a planetary index of geomagnetic activity on a scale from 0 to 9, built from magnetometer readings around the world and reported in three-hour blocks. SWPC's own tips on viewing the aurora describe what each range means in practice:
- Kp 0–2: the aurora stays far north, is dim and not very active.
- Kp 3–5: the aurora moves away from the poles, gets brighter and shows more motion and structure. From the right place, these displays "can be quite pleasing to look at."
- Kp 6–7: the aurora moves further south and becomes bright and active; it may be visible from the northern edge of the United States.
- Kp 8–9: very bright, very active aurora that can be seen directly overhead from the northern states and by the largest number of people.
SWPC also gives a rule of thumb that is handy for understanding why some places need a higher number than others. At Kp 0 the equatorward edge of the auroral oval sits at roughly 66 degrees geomagnetic latitude, and it moves about 2 degrees closer to the equator for each step of Kp:
| Kp | Approximate equatorward edge of the oval (geomagnetic latitude) |
|---|---|
| 0 | 66° |
| 1 | 64° |
| 2 | 62° |
| 3 | 60° |
| 4 | 58° |
| 5 | 56° |
| 6 | 54° |
| 7 | 52° |
| 8 | 50° |
| 9 | 48° |
Two details matter. First, this is geomagnetic latitude, not the latitude on your map. Because the north magnetic pole lies over the islands of northeastern Canada, North America sits "closer" to the aurora than Europe or Asia at the same geographic latitude. Second, you do not need the oval directly overhead. SWPC notes that from a hilltop with an unobstructed view north, a person can see aurora that is as much as 600 miles (1,000 km) further north, low on the horizon.
NOAA's G-scale: geomagnetic storms from G1 to G5
When Kp reaches 5, SWPC calls it a geomagnetic storm and rates it on the NOAA Space Weather Scales, a five-step ladder designed to work like the categories used for hurricanes. The G-level is what you will hear in news alerts ("a G3 storm watch is in effect"), and NOAA's scale table conveniently lists how far south the aurora has been seen at each level.
| Level | Kp | Description | Aurora has been seen as low as | Average frequency (per 11-year cycle) |
|---|---|---|---|---|
| G1 | 5 | Minor | Commonly visible at high latitudes: northern Michigan and Maine | 1,700 times (900 days) |
| G2 | 6 | Moderate | New York and Idaho (typically 55° geomagnetic latitude) | 600 times (360 days) |
| G3 | 7 | Strong | Illinois and Oregon (typically 50°) | 200 times (130 days) |
| G4 | 8, including 9- | Severe | Alabama and northern California (typically 45°) | 100 times (60 days) |
| G5 | 9 | Extreme | Florida and southern Texas (typically 40°) | 4 times (4 days) |
The frequencies are averages over a whole 11-year solar cycle, so they cluster in the busy years around solar maximum. A G5 storm is genuinely rare. The most recent famous one began when the first of several CMEs reached Earth at 12:37 p.m. EDT on Friday, May 10, 2024, according to NOAA; that weekend, people across much of the country photographed the aurora from their backyards. Storms at G1 and G2 levels, by contrast, happen hundreds of times per cycle and are what most aurora chasers in the northern tier of states live on.
"Seen as low as" describes the best cases at each storm level, not a promise. A G3 storm does not guarantee aurora in Illinois; it means Illinois has seen aurora during storms of that strength. Clouds, moonlight, city lights and the timing of the storm's peak all decide whether you actually see it.
Which Kp do you need in your state?
Putting SWPC's Kp descriptions and the G-scale together gives a practical rule of thumb for the United States. Treat it as a starting point, not a guarantee: SWPC itself stresses that the relationship between Kp and auroral latitude is approximate and represents averages.
| Where you are | Kp that usually brings the aurora into view | What you will typically see |
|---|---|---|
| Interior and northern Alaska (Fairbanks) | Low activity, Kp 1–3, on dark clear nights | Arcs and curtains overhead; on active nights, the whole sky |
| Southern Alaska (Anchorage, Juneau) | Low to moderate activity, around Kp 2–4 | Aurora to the north, often climbing high during storms |
| Northern tier: Washington, Montana, North Dakota, Minnesota, Michigan's Upper Peninsula, Maine | Kp 5–6 (G1–G2) | A green or reddish glow low in the northern sky; rays during stronger storms |
| New York, Idaho, Wisconsin, northern New England, Oregon | Kp 6–7 (G2–G3) | Low glow on the northern horizon, best seen with a camera |
| Illinois, Pennsylvania, the central Plains and Rockies | Kp 7–8 (G3–G4) | Red and pink glow; phone cameras pick up more than the eye |
| Southern states, Florida, Texas | Kp 9 (G5) | Rare, usually a red glow low to the north |
For a city-by-city figure, our northern lights tonight page calculates each city's geomagnetic latitude and the Kp at which the aurora reaches its northern horizon – see for example Fairbanks, Minnesota, Michigan or Maine.
The OVATION model and the 30-minute aurora forecast
The map that most apps show as a "northern lights tonight map" – a green oval, turning yellow and red where the aurora is most intense – is SWPC's Aurora 30-Minute Forecast. It runs on the OVATION model (Oval Variation, Assessment, Tracking, Intensity, and Online Nowcasting), an empirical model developed by Patrick Newell and colleagues at the Johns Hopkins University Applied Physics Laboratory.
OVATION takes the speed of the solar wind and the strength and direction of the interplanetary magnetic field measured at the L1 point, about 1 million miles (1.6 million km) upstream from Earth, and calculates how much energy is pouring into the upper atmosphere. The forecast's lead time is simply how long that solar wind takes to travel from L1 to Earth – 30 to 90 minutes. SWPC converts the modeled intensity into a viewing probability and draws it on maps of the Northern and Southern Hemispheres.
Some things to know when you read the OVATION map:
- The oval is centered on the magnetic pole, which is why it dips much further south over North America than over Europe.
- You can be outside the colored area and still see aurora. SWPC notes that bright aurora can be observed from as far as about 600 miles (1,000 km) away, low on the horizon.
- Daylight hides everything. The map shades the sunlit side of Earth; aurora is not visible there.
- Sometimes there is no lead time. When solar wind data are missing or contaminated, OVATION falls back on the current Kp and the forecast becomes a nowcast.
The model has been upgraded over the years. SWPC says the original version was only reliable up to Kp 7; adding data from NASA's TIMED satellite extended it to Kp 8 and 9 storms, and a new operational version called OVATION 2020 went live in 2020.
The 3-day forecast, the viewline and the 27-day outlook
For planning an evening, the most useful products are the 3-day forecast – a plain-text bulletin of predicted Kp in three-hour blocks plus the chance of a geomagnetic storm – and the experimental Aurora Viewline for tonight and tomorrow night, which draws a line across North America showing the southernmost point where the aurora might be seen on the horizon. If you live north of the line, it is worth checking the sky; if you live south of it, odds are poor.
Searches for a "28 day aurora forecast" usually lead to SWPC's 27-day outlook. It works because the Sun rotates roughly once every 27 days as seen from Earth, so active regions and coronal holes that disturbed the field once often come back around. It is a genuine product, but a coarse one: it gives a single largest Kp per day. The outlook issued on October 12, 2026, for example, called for a largest Kp of 5 on October 13 and of 4 on October 22 and 23, and 2 on most other days through the end of October. Use it to pick candidate weeks for a trip, not to promise a show on a particular night.
When the aurora is most likely: time of night and season
SWPC's guidance is consistent: the best aurora is usually within an hour or two of local midnight, between about 10 p.m. and 2 a.m. During stronger storms that window widens toward the evening and the early morning. Activity also tends to come in surges called substorms – the sky may be quiet for an hour and then erupt for 20 minutes – so patience pays.
Seasons matter too. SWPC notes a tendency for larger geomagnetic storms near the spring and fall equinoxes, and the long nights from late August to April give northern viewers many more dark hours than summer does. In Alaska the aurora is essentially invisible from late spring to late summer simply because it never gets dark enough.
| Step | What to check | Where |
|---|---|---|
| 1. Afternoon | Is a storm (G1 or higher) forecast for tonight? What is the highest Kp in the 3-day forecast? | SWPC 3-day forecast, our tonight page |
| 2. Evening | Are you north of the viewline? Will it be cloudy after dark? | Aurora viewline, local weather forecast |
| 3. After dark | Is the OVATION oval bright and expanding toward you? | SWPC 30-minute forecast |
| 4. Outside | Look north, away from lights, and take a test photo with your phone | A dark spot with an open northern horizon |
Why aurora forecasts miss
Even professional forecasters get surprised, for reasons that are built into the physics. The speed of a CME can be estimated from images of the Sun, but its arrival time at Earth can still be off by many hours – so a storm forecast "for tonight" may peak in daylight over North America. Equally important is the orientation of the magnetic field the CME carries: when it points southward, opposite to Earth's field, energy flows in efficiently and the aurora flares; when it points northward, even a fast CME can produce a disappointing night. That orientation can only be measured once the CME passes the spacecraft at L1, which is why the 30-minute forecast is so much more reliable than anything issued a day ahead.
The practical lesson: treat a 3-day forecast as a "be ready" signal, and make the go or no-go decision with the OVATION map and a look at the sky. Our tonight page combines NOAA's Kp forecast with hourly cloud cover for each city for exactly this reason.
Forecast terms at a glance
| Term | Meaning |
|---|---|
| Kp index | Planetary geomagnetic activity, 0 (quiet) to 9 (extreme), in three-hour blocks |
| G-scale | NOAA storm levels G1 (Kp 5) to G5 (Kp 9) |
| CME | Coronal mass ejection: a cloud of solar plasma that can trigger a storm when it reaches Earth days after leaving the Sun |
| OVATION | Model behind SWPC's 30–90 minute aurora forecast map |
| Viewline | Southernmost line from which aurora may be seen on the horizon |
| Substorm | A sudden brightening of the aurora that can last minutes to an hour |
Once you know how to read a forecast, the next questions are where to go and when in the season – covered in where and when to see the northern lights in the US – and how to capture what you see, in how to photograph the northern lights. If you are planning around moonlight, the full moon calendar shows which nights will be darkest.
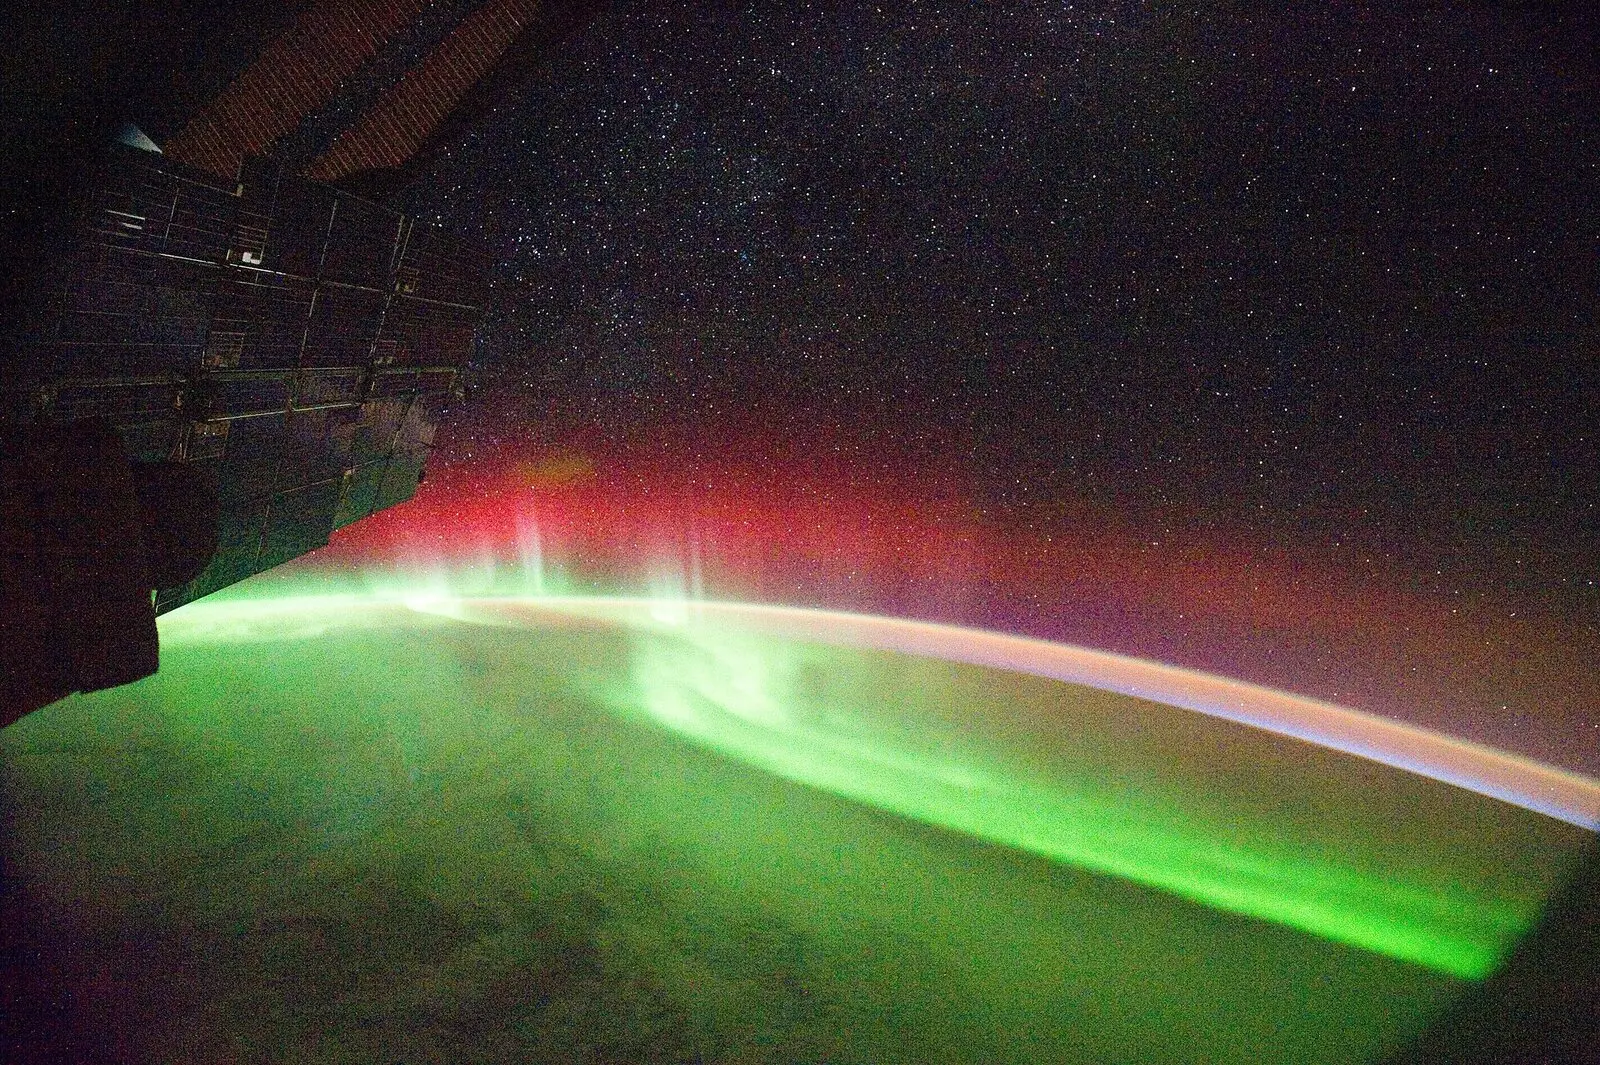
Cover photo: NASA -- US government agency, Wikimedia Commons (public domain).

Frequently asked questions
What Kp index do I need to see the northern lights?
In interior Alaska a Kp of 1 to 3 is often enough on a clear dark night. The northern tier of the lower 48 states usually needs Kp 5 to 6 (G1 to G2), the middle of the country Kp 7 to 8, and the southern states a rare Kp 9 storm.
How accurate is the northern lights forecast?
The 30-minute OVATION forecast is the most accurate because it uses solar wind already measured about 1 million miles upstream. Forecasts a day or more ahead are uncertain: a storm can arrive hours early or late and the magnetic field it carries can point the wrong way for a strong display.
What time will the northern lights be visible tonight?
NOAA's Space Weather Prediction Center says the best aurora usually appears within an hour or two of local midnight, roughly 10 p.m. to 2 a.m. During strong storms the window can open in the evening and last until dawn.
What does a G3 geomagnetic storm mean for the aurora?
G3 (Strong) corresponds to Kp 7. NOAA's scale notes that aurora has been seen as low as Illinois and Oregon during storms of this strength, though clouds, moonlight and timing decide whether you see it.
Is there a northern lights forecast by zip code?
NOAA does not publish one by zip code, but its aurora viewline shows the southernmost point from which the lights may be seen tonight. Our northern lights tonight page converts the Kp forecast into a city-by-city outlook with cloud cover.
What is the OVATION aurora forecast?
OVATION is an empirical model from the Johns Hopkins University Applied Physics Laboratory. NOAA runs it in real time to map where the aurora is likely to be visible in the next 30 to 90 minutes.
Is there a 28-day aurora forecast?
The closest official product is NOAA's 27-day outlook, which lists the largest expected Kp for each day based on the Sun's 27-day rotation. It is useful for choosing a travel window, not for predicting a specific night.
Why is the aurora forecast high but I see nothing?
The storm may peak during daylight in your time zone, the magnetic field may point northward and limit the display, or clouds and city lights may hide a faint glow. A phone camera in night mode often reveals aurora that the eye misses.
Sources
- NOAA SWPC – Tips on viewing the aurora
- NOAA SWPC – NOAA Space Weather Scales
- NOAA SWPC – Aurora 30-minute forecast (OVATION)
- NOAA SWPC – Planetary K-index
- NOAA SWPC – 3-day forecast
- NOAA SWPC – Aurora viewline for tonight and tomorrow night (experimental)
- NOAA SWPC – 27-day outlook of 10.7 cm radio flux and geomagnetic indices
- NOAA – Strong geomagnetic storm reaches Earth (May 2024)
Log in to comment
No comments yet. Be the first.